
Categories
Market UpdatesPublished August 24, 2026
Real Estate Market Update for Greater Portland - August 2026


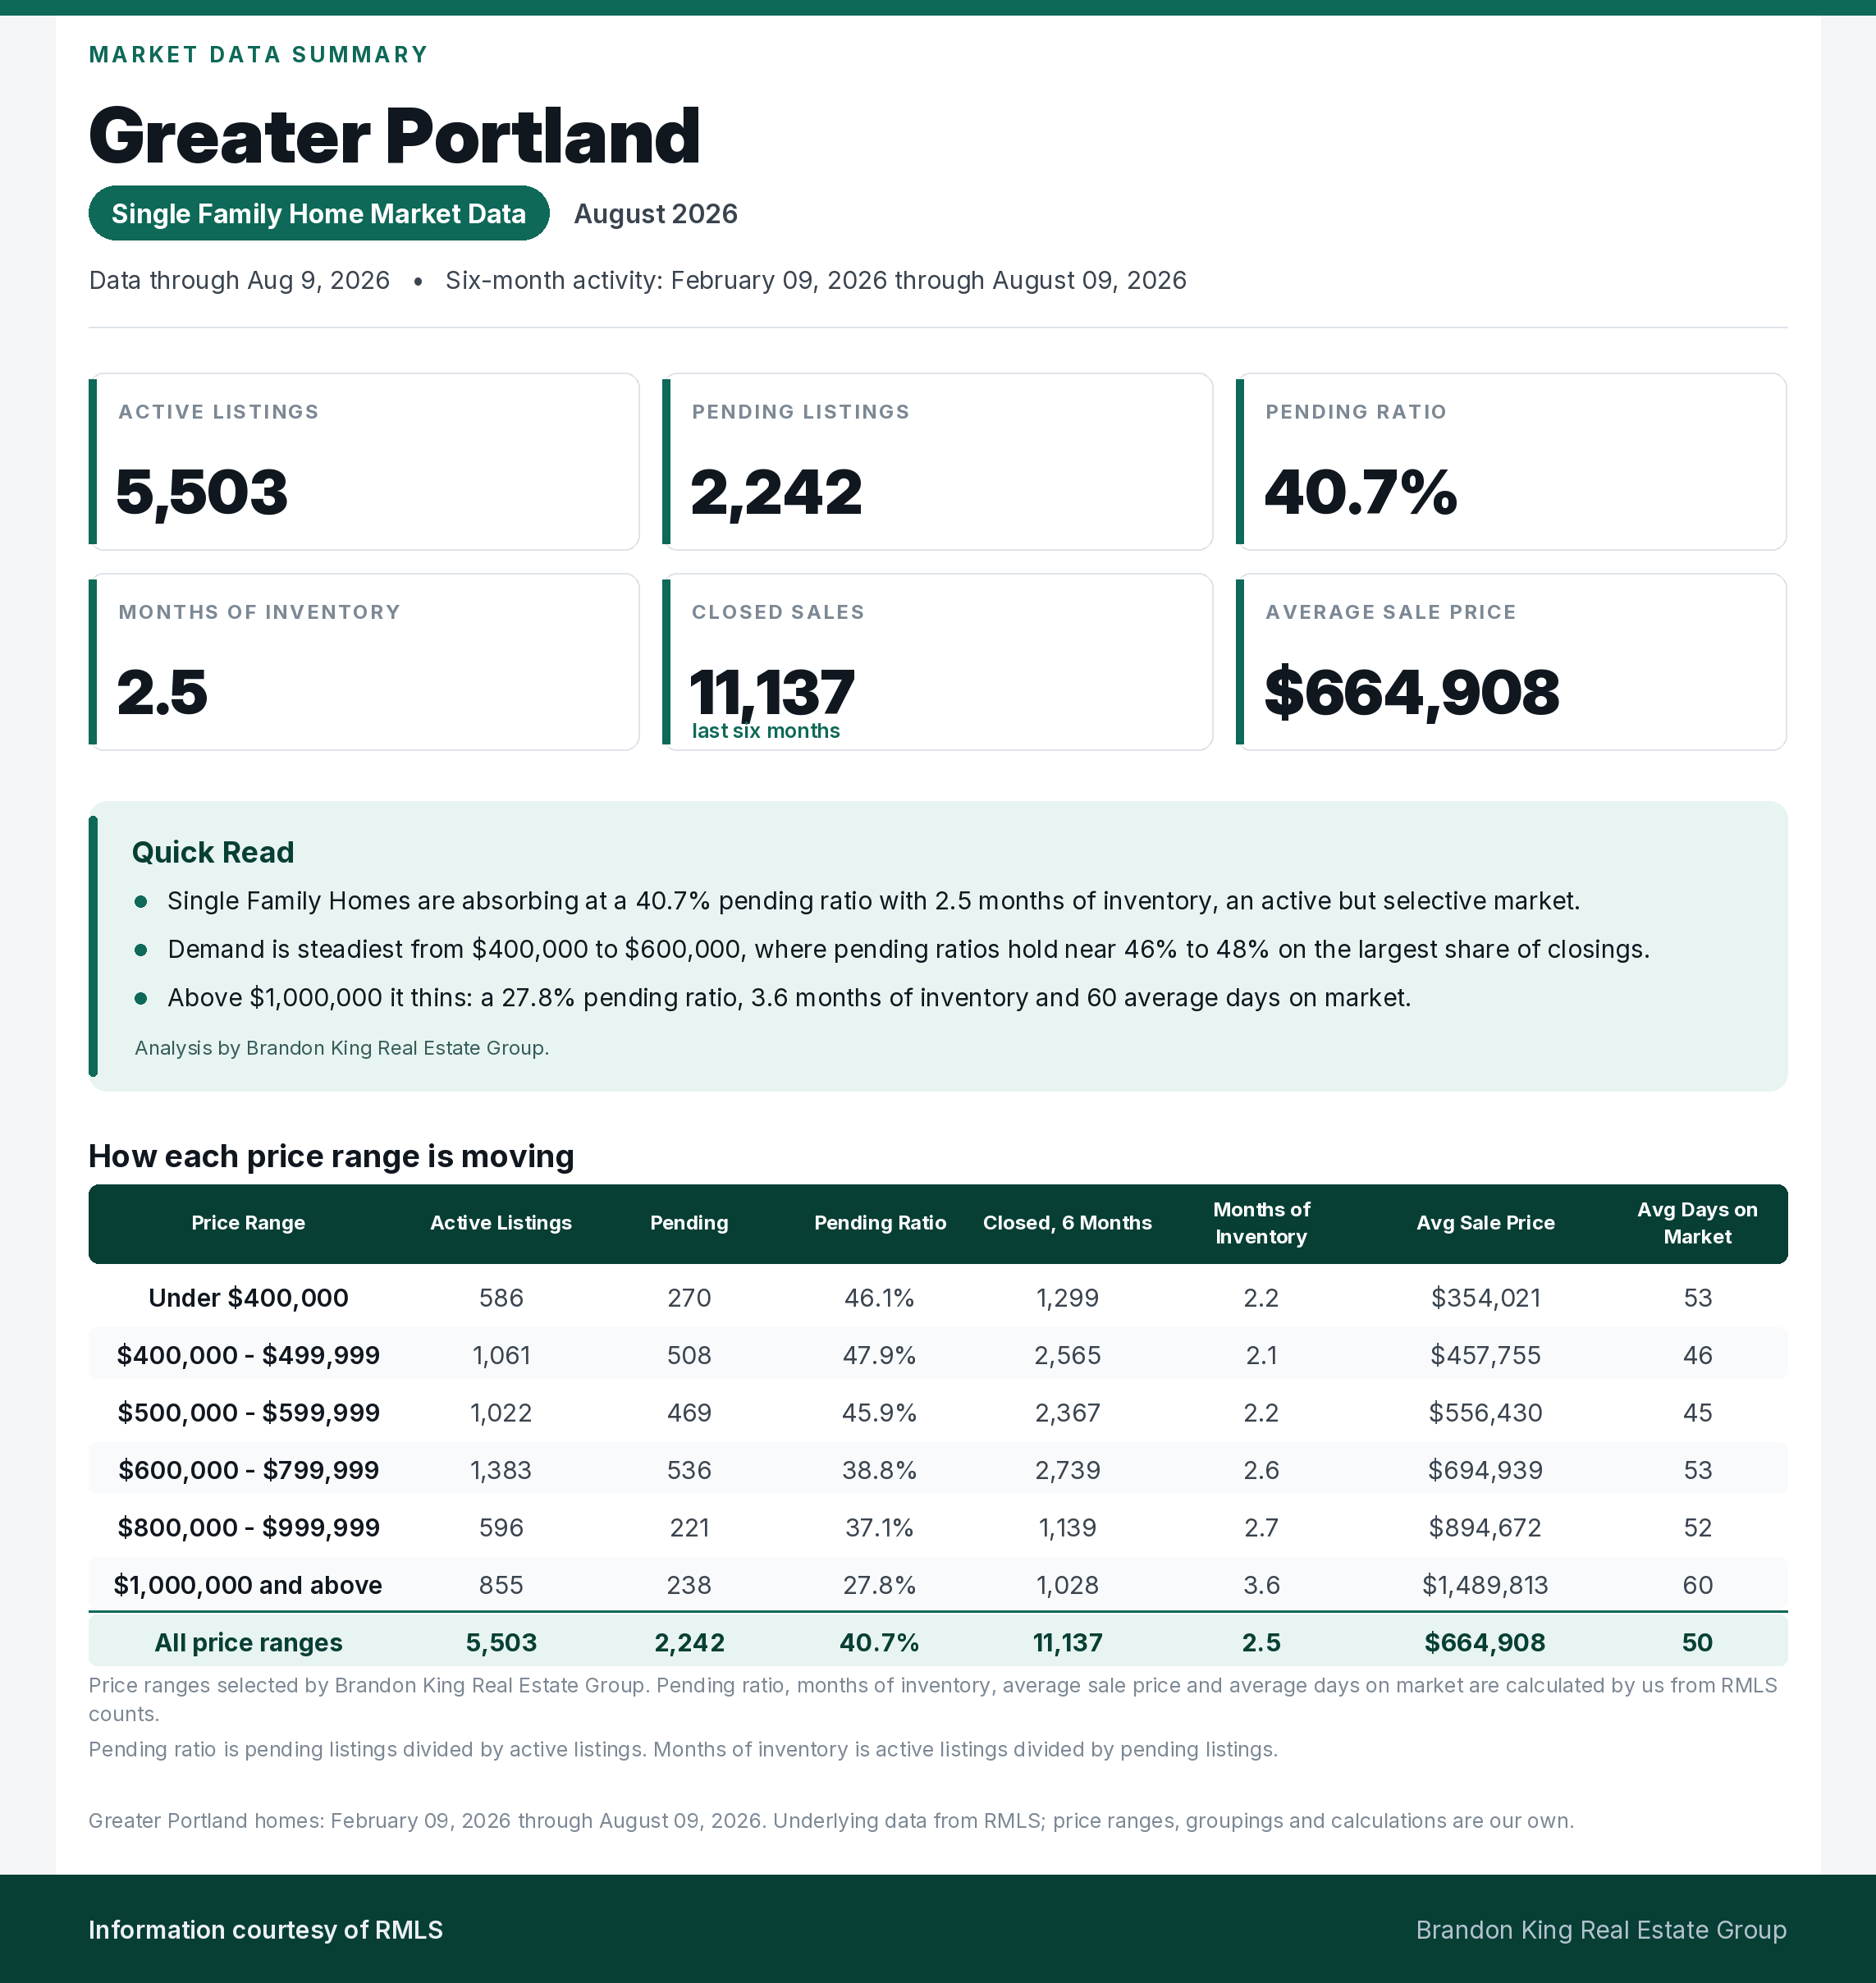
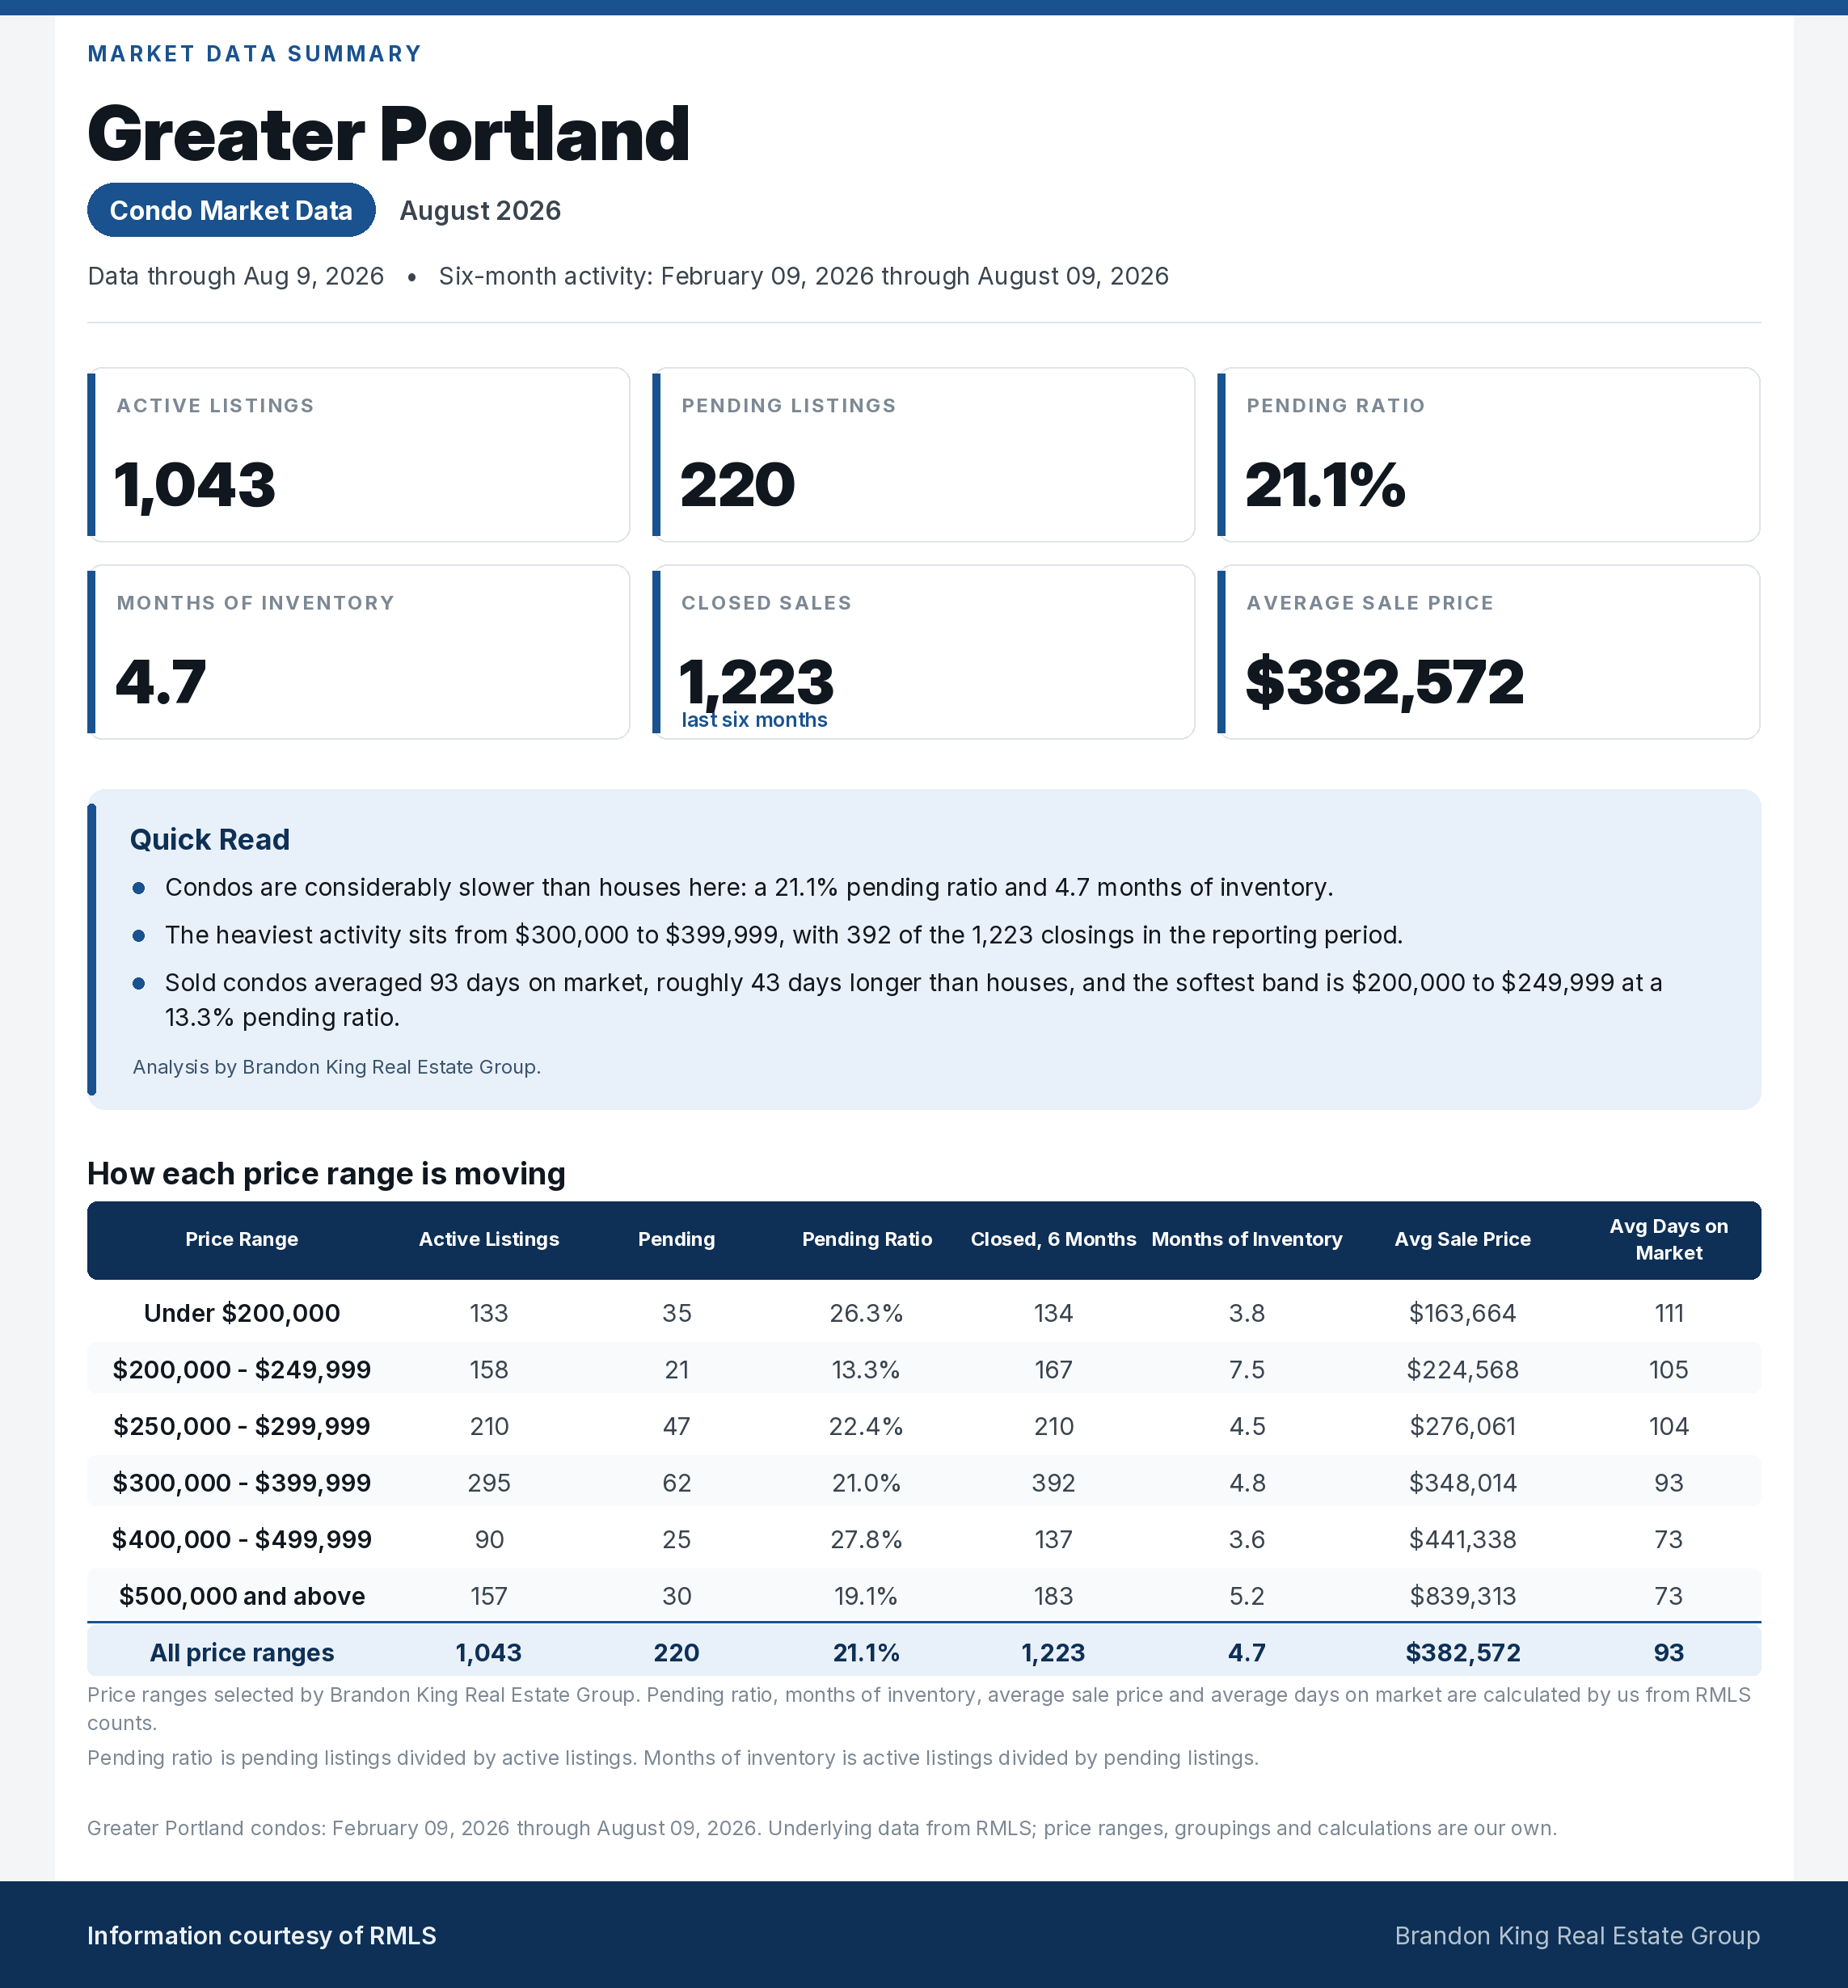
If you're trying to understand the Greater Portland real estate market right now, the most important thing to know is that the Single Family Home and Condo segments are not moving at the same pace. Single Family Homes are showing the stronger demand signal. As of Aug 9, 2026, current market data shows 5,503 active Single Family Home listings and 2,242 pending listings, for a 40.7% pending ratio and 2.5 months of inventory. Condos show 1,043 active listings and 220 pending listings, a 21.1% pending ratio and 4.7 months of inventory.
That difference is a good reminder that there is no single answer to the question, "How is the Greater Portland housing market?" The answer depends on property type, price point, condition and how accurately a home is positioned against the competition.
The Big Picture
Over the six-month period, sold Single Family Homes in Greater Portland averaged a sale price of $664,908 and 50 days on market. That points to an active but selective market rather than a market where every listing sells easily.
Over that same six-month period, sold Condos averaged a sale price of $382,572 and 93 days on market. That is a slower market with more negotiating room for buyers and less tolerance for ambitious pricing.
Single Family Homes have 2.5 months of inventory versus 4.7 months for Condos, so a buyer looking at a detached home may experience a noticeably different negotiation environment from a buyer looking at a Condo in the same general area.
Single Family Home Market
As of Aug 9, 2026, there are 5,503 active Single Family Home listings and 2,242 pending sales in this market. The pending ratio is 40.7%.
The highest volume of closed activity was in the $500,000-$599,999 range, with 2,367 closed sales during the six-month period. One of the stronger demand signals was $225,000-$249,999, where the pending ratio was 68.8% with 16 active and 11 pending listings. At the softer end of the meaningful sample, $2,000,000+ had a 14.9% pending ratio, with 194 active and 29 pending listings.
The pricing numbers also show why the first list price matters. Over the six-month period, the Single Family Homes that sold had an average original list price of $681,540, an average final list price of $666,402, and an average sale price of $664,908. That represents about a 2.2% adjustment before the sale, while the final sale price was 99.8% of the final asking price. In other words, correctly priced homes can still sell close to the number buyers see when they make an offer, but some sellers are having to reposition first.
The bigger point is that the average does not describe every seller's experience. A home in one of the stronger price bands can still get fast attention when it is clean, well presented and priced in line with recent competition. A home in a slower bracket can require more patience even when the broader market statistics look healthy.
Condo Market
The Condo side is more selective. There are 1,043 active Condo listings and 220 pending listings, producing a pending ratio of 21.1%. There are 4.7 months of inventory. Sold Condos averaged 93 days on market over the six-month period.
The highest volume of closed activity was in the $275,000-$299,999 range, with 132 closed sales during the six-month period. One of the stronger demand signals was $425,000-$449,999, where the pending ratio was 39.1% with 23 active and 9 pending listings. At the softer end of the meaningful sample, $200,000-$224,999 had an 8.8% pending ratio, with 57 active and 5 pending listings.
Pricing discipline is showing up clearly in the numbers. Over the six-month period, the Condos that sold had an average original list price of $407,382, an average final list price of $389,170, and an average sale price of $382,572. That is roughly a 4.5% adjustment from the original asking price to the final asking price. Once sellers reached the right number, the average sale landed at 98.3% of the final list price. The takeaway is not that buyers are automatically getting huge discounts. It is that the market is making overpriced listings correct before they sell.
For Condo sellers, the building, HOA, monthly dues, parking, reserves, rental rules and exact unit condition can matter as much as the broad neighborhood numbers. Two Condos with similar square footage can compete very differently depending on those details.
Single Family Homes vs. Condos
Single Family Homes are currently moving more efficiently than Condos in Greater Portland. The Single Family Home pending ratio is 40.7% versus 21.1% for Condos. Single Family Homes have 2.5 months of inventory versus 4.7 months for Condos. Over the six-month period, sold Single Family Homes averaged 50 days on market versus 93 days for sold Condos. Average sale price was 99.8% of average final list price for Single Family Homes and 98.3% for Condos. That gap is why broad statements about the Greater Portland real estate market can be misleading. Property type matters.
This is also why I would not use a citywide or countywide average to price an individual property. The right comparison is the closest set of homes a real buyer would consider as alternatives.
What This Means for Sellers
For sellers, this is a market where preparation and pricing can make a noticeable difference in both time and outcome. There is enough activity to produce a good sale, but buyers are not treating every listing equally. Homes that begin too high can lose the strongest early attention and end up adjusting later.
Condo sellers should generally be even more precise. With a Condo pending ratio of 21.1% and 4.7 months of inventory, buyers have more choices and more ability to compare one unit against another. Condition, HOA strength and price positioning can have an outsized effect on market time.
What This Means for Buyers
For buyers, there is a useful middle ground here. Good homes can still attract competition, but there is enough inventory to compare options and be selective. Listings that have been on the market longer or have already adjusted price may offer more negotiating room than fresh, well-priced inventory.
Condo buyers have additional leverage in many parts of this market because the overall pace is slower. That does not mean every Condo is negotiable, particularly a well-priced unit in a desirable building, but it does mean buyers should look carefully at market time, price history and competing inventory before deciding how aggressive an offer needs to be.
Bottom Line
The Greater Portland real estate market is active, but it is not uniform. Single Family Homes currently show a 40.7% pending ratio and 2.5 months of inventory, while Condos show a 21.1% pending ratio and 4.7 months of inventory. Those are materially different conditions.
The question I would ask is not simply, "Is the market good or bad?" It is, "How is the market for this type of property, in this price range, against the homes it is actually competing with right now?"
If you're considering buying or selling in Greater Portland, Brandon King Real Estate Group can help you narrow the broader market data down to the specific property, neighborhood and price range that matter to your decision.
Single Family Home Market Data
Condo Market Data

Brandon King
Principal Broker & Team Leader | Brandon King Property Group | Keller Williams Realty Portland Central
or another way